 Fluent BI
AI business intelligence
Turn hours of reporting into answers
Fluent BI is an AI-powered business intelligence app for spreadsheets and documents. Upload Excel, CSV, PDF, or Word, ask in plain English, and get charts, live dashboards, and PDF reports — no SQL, no code.
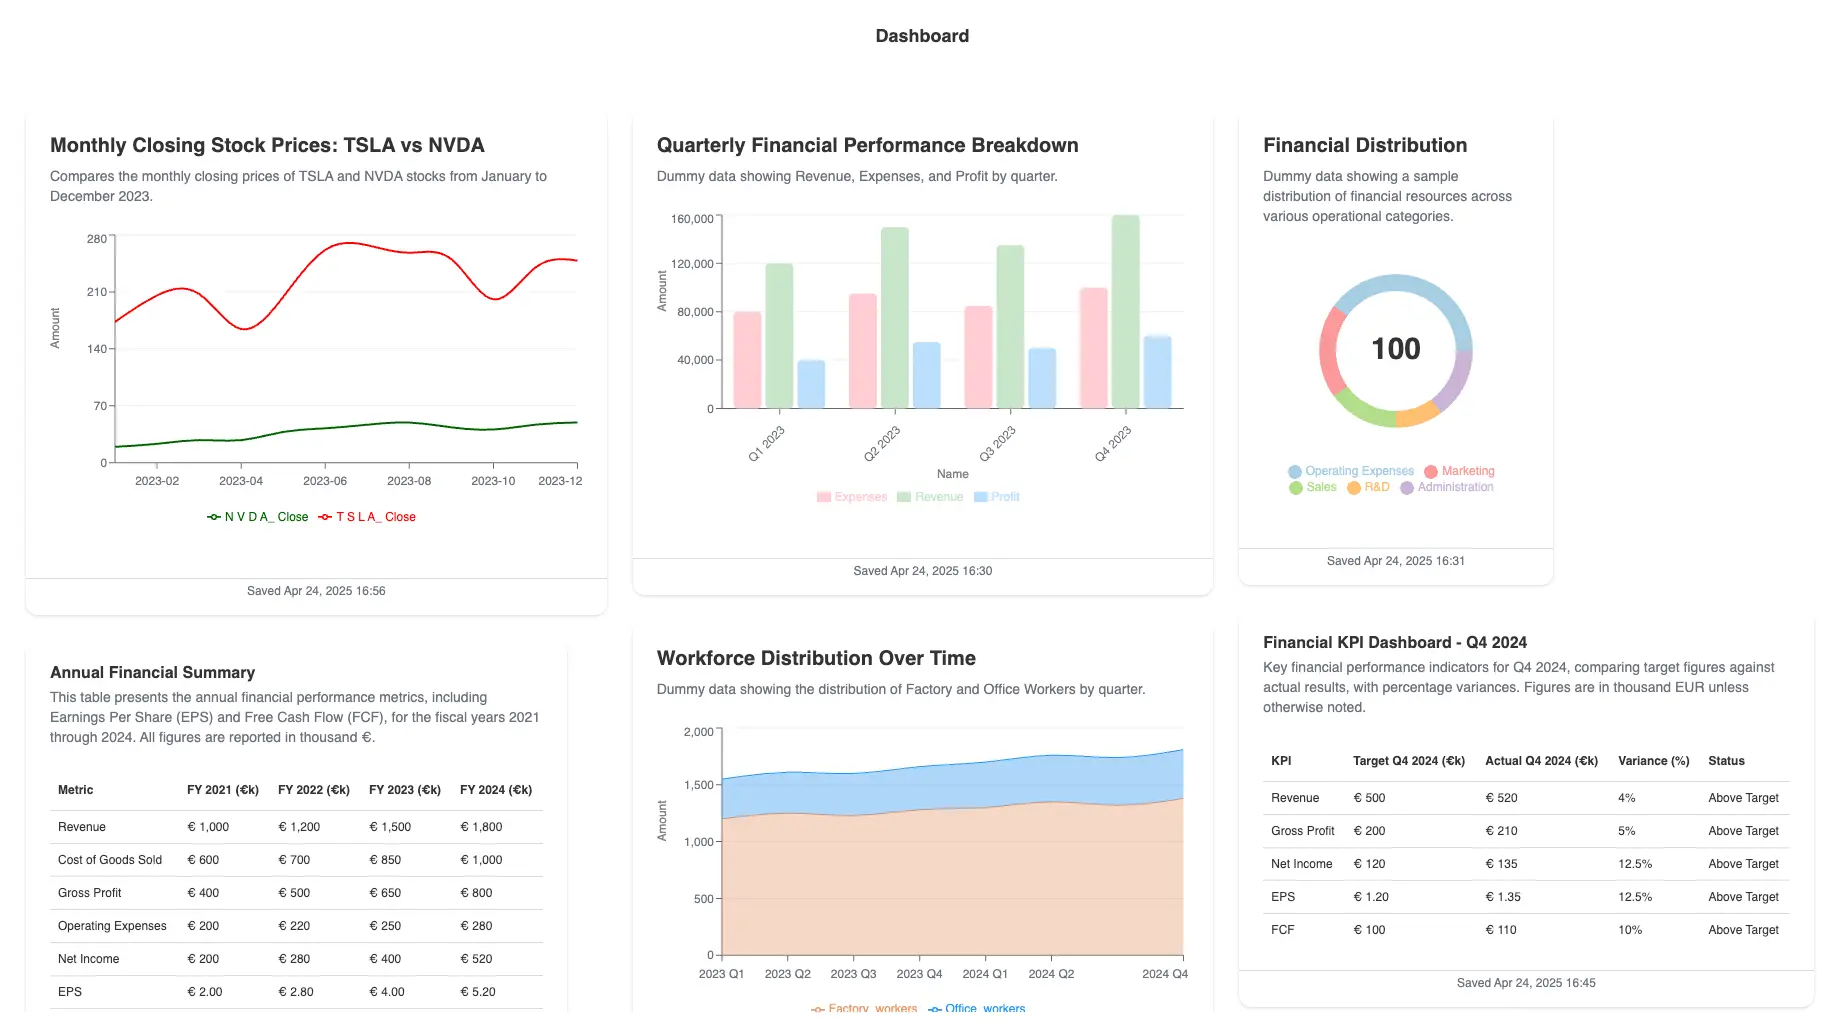
See it turn a file into a dashboard
A short walkthrough of uploading data, asking a question, and getting charts you can share.
Muted preview. Use the controls to pause or replay.
Manual reporting is eating the week
Scattered spreadsheets, siloed CSVs, and stale PDFs keep teams stuck in copy-paste mode. You lose hours, ship mistakes, and never get a live picture of the business.
- Wasted hours wrangling complex Excel formulas
- Chasing stakeholders for updated numbers
- No BI budget or SQL expertise
- Relying on static dashboards that stall progress
Before Fluent BI
- Copy-pasting numbers between sheets
- Chasing stakeholders for report updates
- Guessing which chart best tells the story
- Waiting days for analysts
After Fluent BI
- Ask in plain English and get instant insights
- Interactive self-service dashboards
- Shareable live dashboards for automated reporting
- One-click PDF reports
- No setup, no SQL
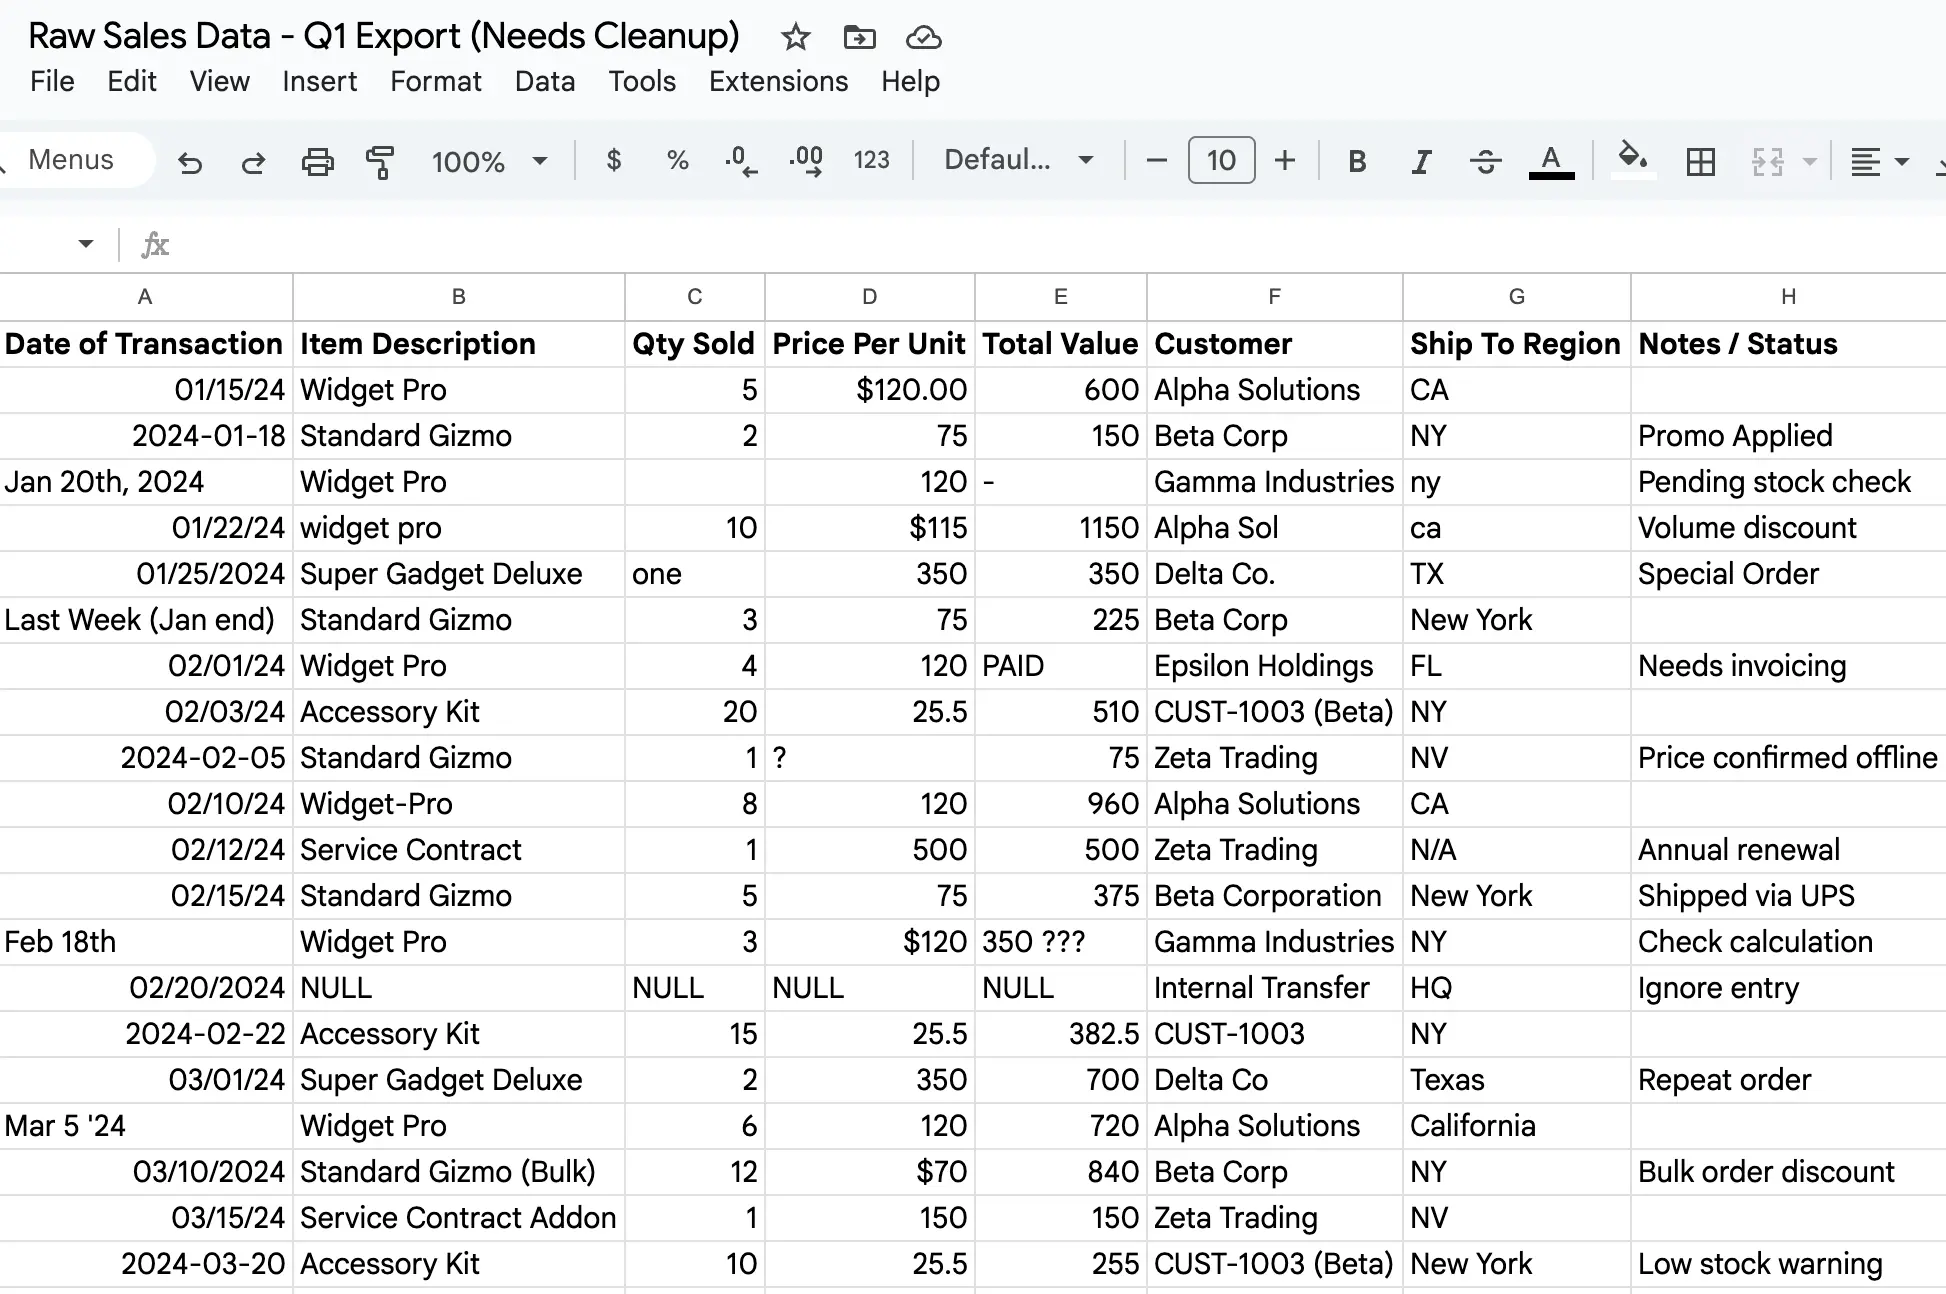
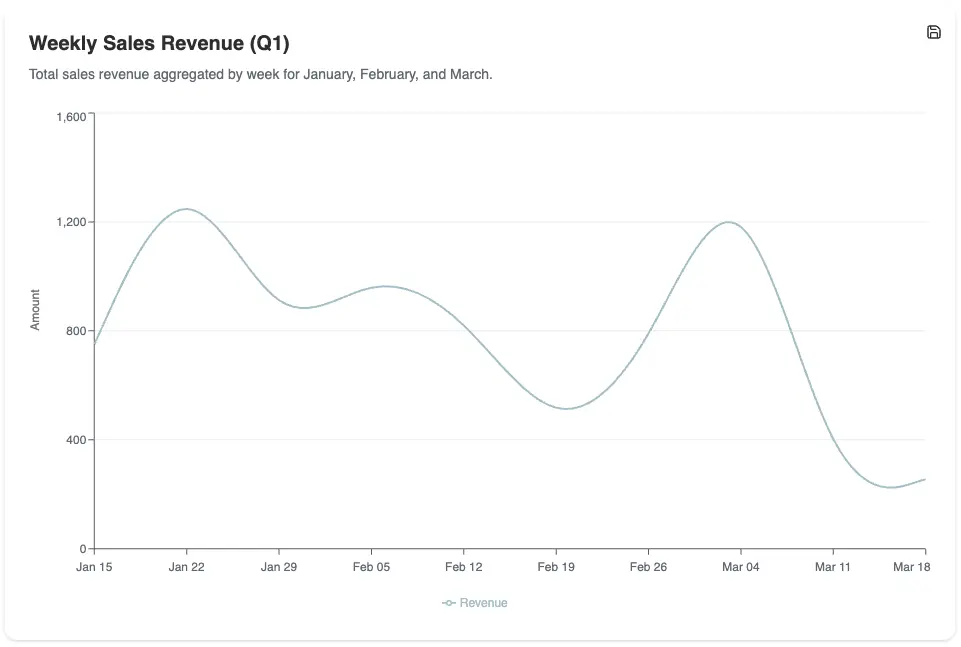
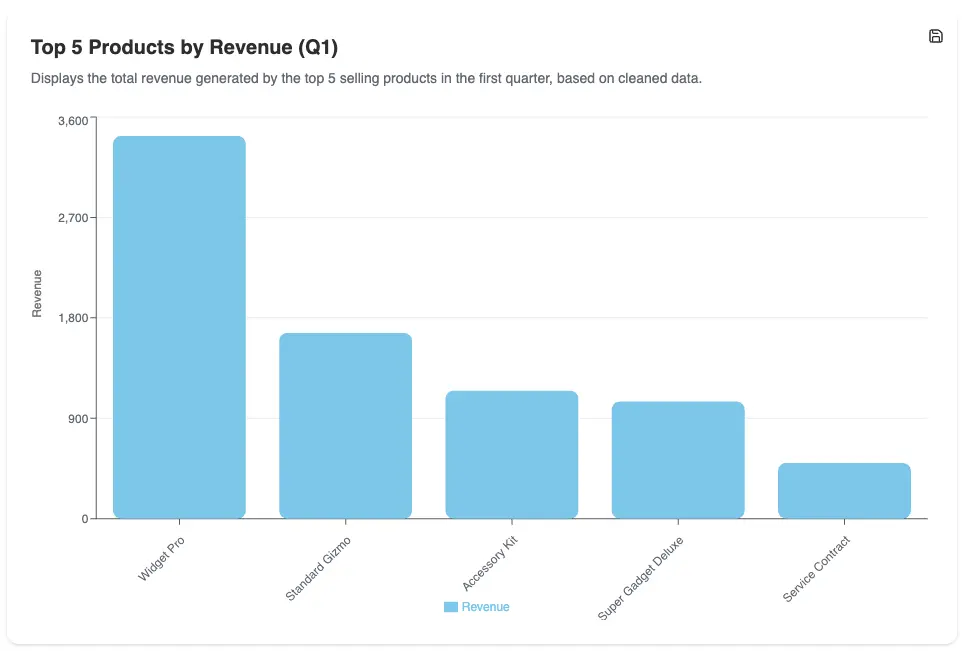
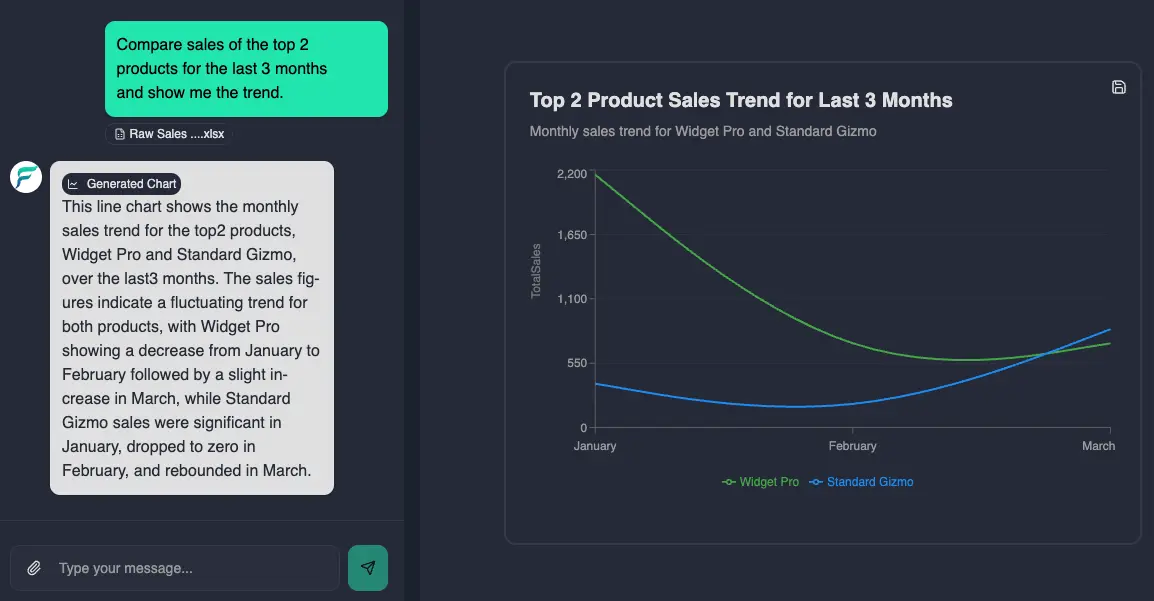
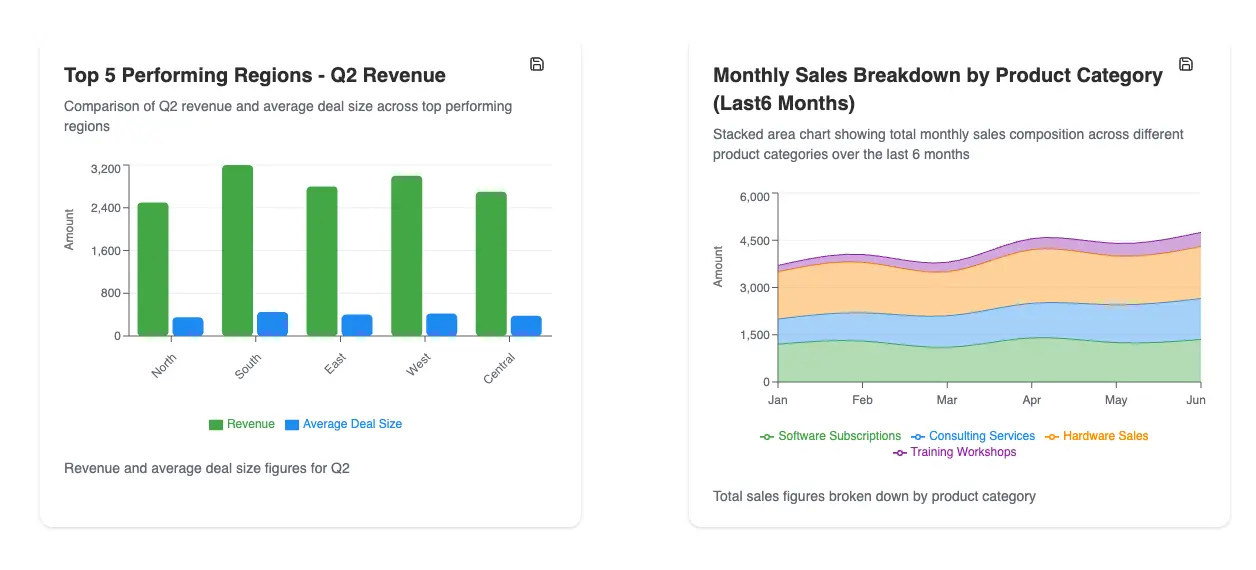
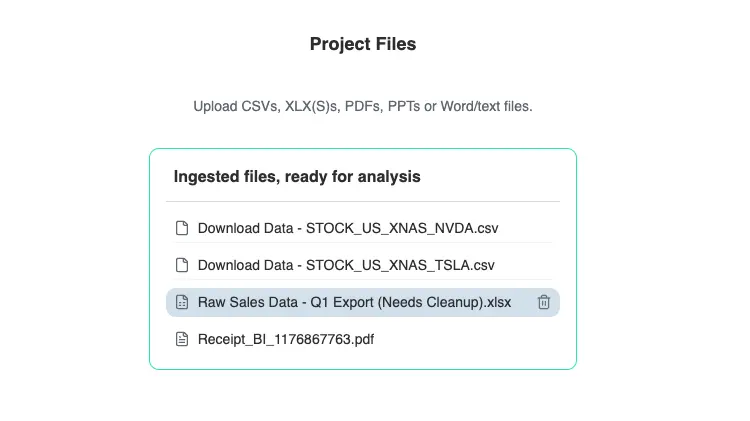
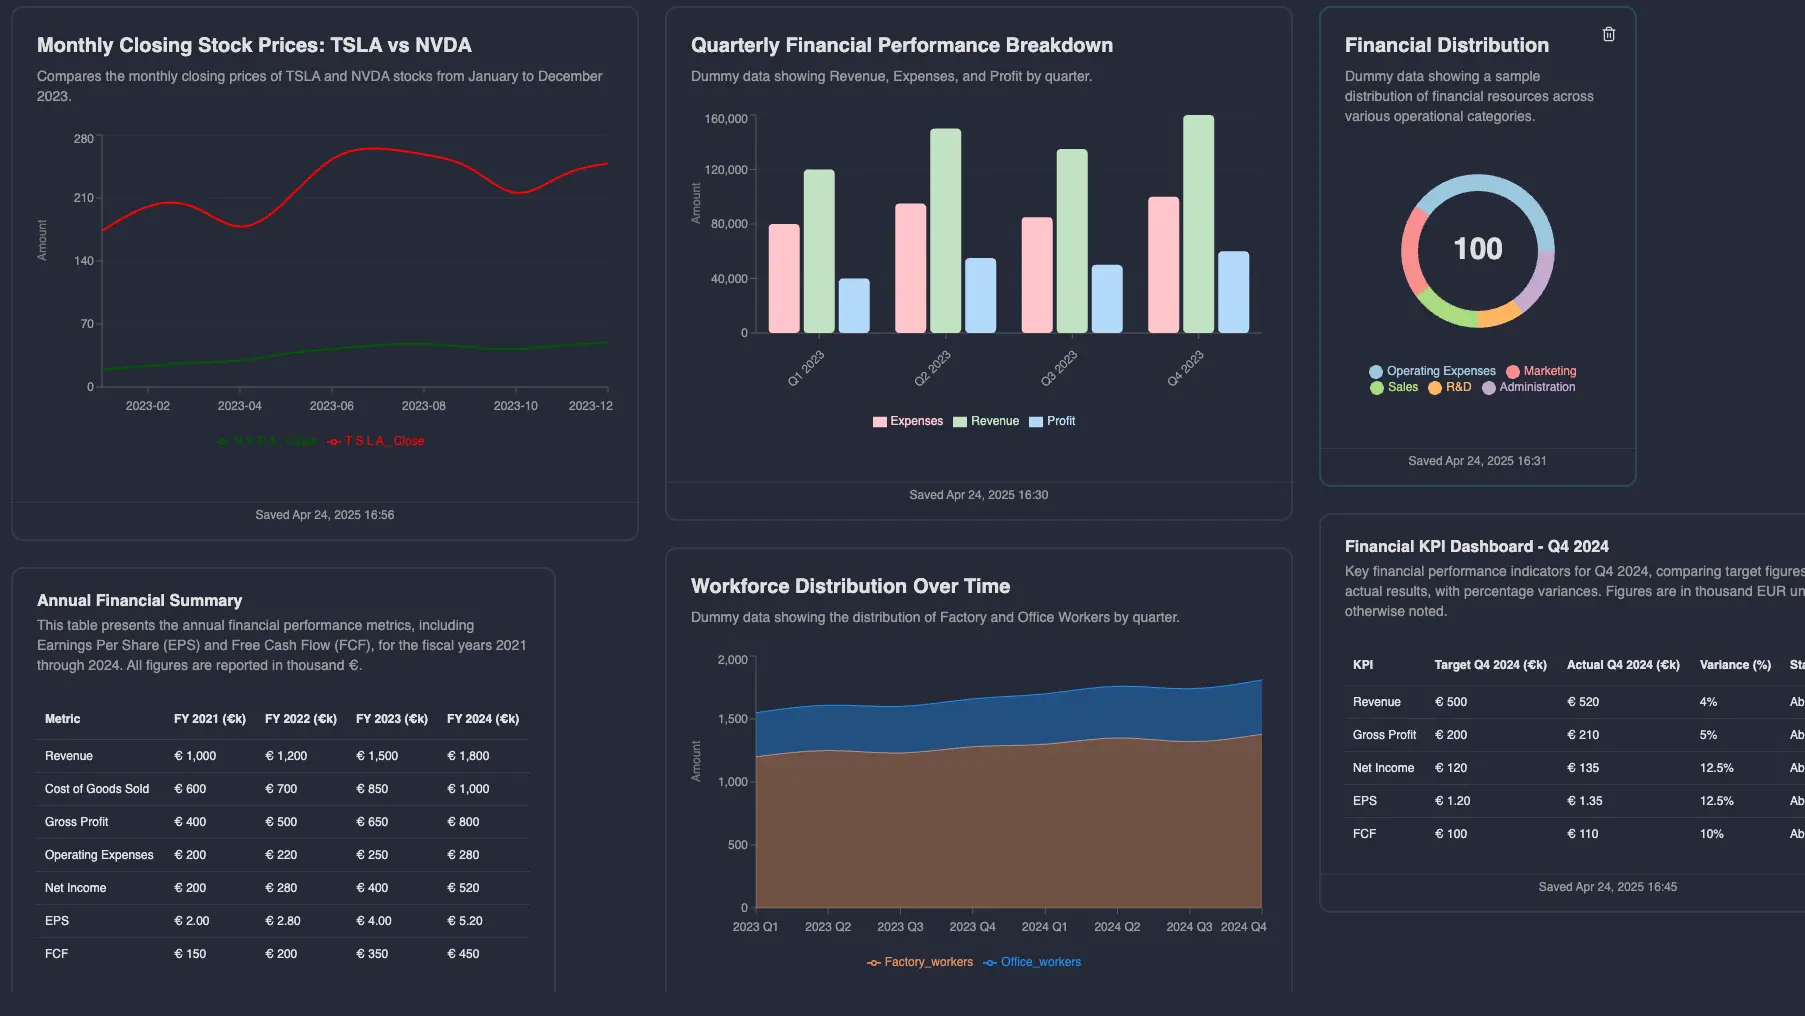
From file upload to a report you can send
Everything you need to go from raw data to an answer — no training required.
From the people using it
Early feedback from real client work. More reviews will land here as the rollout grows.
“My clients love the visual dashboards. I love that I don't have to build them by hand.”

Moes, Founder
Fluent BI
Simple pricing
Start free. Upgrade when the work outgrows Hobby. Cancel anytime.
Explore self-service analytics with up to 50MB of data and basic AI chat.
- 100 messages per month
- 50 MB total upload
- 1 project
- Basic charts and tables
Most popular
More AI queries, advanced visualizations, and priority processing for power users.
- Everything in Hobby
- 500 requests per month
- Unlimited projects
- Up to 100 file uploads
- Unlimited dashboards
- PDF export in portrait or landscape
Real-time collaboration, role-based access, and shared dashboards for growing teams.
- Team workspaces
- Permissions
- Slack alerts
Ready to stop wrestling spreadsheets?
Start free on Hobby. Upload a file, ask a question, and get a chart back — then upgrade when you need more.








Teams already using AI business intelligence
Requests processed
Charts and tables generated
Faster reporting*
Time to first insight*
*Estimated versus typical spreadsheet reporting. Actual results vary with data complexity.